

Hack-A-Sat 2020 - Launch Link
Data Link Layer Protocol Firmware Reversing and Exploitation
Hack-A-Sat CTF 2020 is a space security themed CTF that took place this past week, and it had some really great challenges. One of which is Launch Link, a reversing + pwn task which was solved by only one team during the competition.
We (VoidMercy and Jazzy) spent around 15 hours during the CTF reversing the firmware, but gave up around 6 hours before the end due to sleep deprivation and other unsolved easy challenges. However, we came back afterwards and managed to solve it with around 5-6 more hours of work.
In hindsight, we should have kept working on the challenge.
This is cross-post of my post (on my CTF team’s blog) here
Challenge Description
Our team managed to download off an open FTP server from LaunchDotCom’s website and found some interesting documents about their upcoming Satellte Internet service. We’ve figured out how to communicate over the RF link but we need your help to figure out how to exploit the baseband processor on the satellite.
We’ve managed to download the firmware for the baseband processor of the payload module from the open FTP server.
It appears they graciously left an emulator on their public FTP server for debugging their platform, we have provided that as well. Our team has determined that the target system uses 2MB of RAM and to run the emulator use the following command line:
vmips -o memsize=2097152 firmware.bin
Our team would like to access sensitive data located 0xa2008000 on the running system.
Good Luck!
Overview
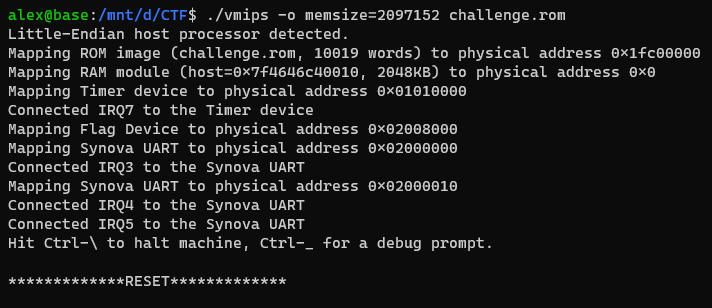
The challenge includes a ROM file and a binary vmips. As the name states, it’s most likely an emulator for MIPS.
In fact, it turns out that the vmips binary is a modified vmips emulator. In comparision, there were a few changes (which we will get to in the reversing), the most prominent one is adding a custom Flag device.
Instead of exploiting vmips, our target is most likely to exploit the emulated ROM and interface with the Flag device to read the flag. Now let’s start the reversing…
Reverse Engineering
After reading a little bit about vmips, we discover that the ROM file is a mipsel (32 bit MIPS little endian) blob whose entry point is at physical offset 0x0, mapped at a virtual address 0xbfc00000.
As expected with firmware ROMs, the binary is completely stripped, so we will have to create segments, rename variables, and create structs ourselves, which is the most time consuming portion of this challenge. With this information, we can fire up our favourite disassembler and begin reversing.
Instead of using IDA as we normally would, we decided to opt for Ghidra due to it’s superior support for MIPS. As no-one in our team doesn’t knew a whole lot about Ghidra, we thought it would be good chance to learn the UI, shortucts, and features.
Like IDA, when loading a binary, you must select the processor architecture and the base address at which the binary is loaded at. In this case, the binary is a mips-default-little-32 architecture, loaded at 0xbfc00000.
+1 to Ghidra for decompiling MIPS. At the entry point, we see the following pseudocode:
puVar4 = (undefined4 *)&DAT_bfc08ef8; // 0xbfc08ef8 - Src buffer
puVar7 = &_gp_1; // 0xa0180000 - Destination buffer
do {
  *puVar7 = *puVar4;
  puVar4 = puVar4 + 1;
  puVar7 = puVar7 + 1;
} while (puVar4 != (undefined4 *)0xbfc09c8c); // Copy loop
uVar9 = 0xbfc00510;
main_logic(); // Main func
An important step for firmware and embedded binaries in general is to set-up segments, which is exactly what the binary is doing here.
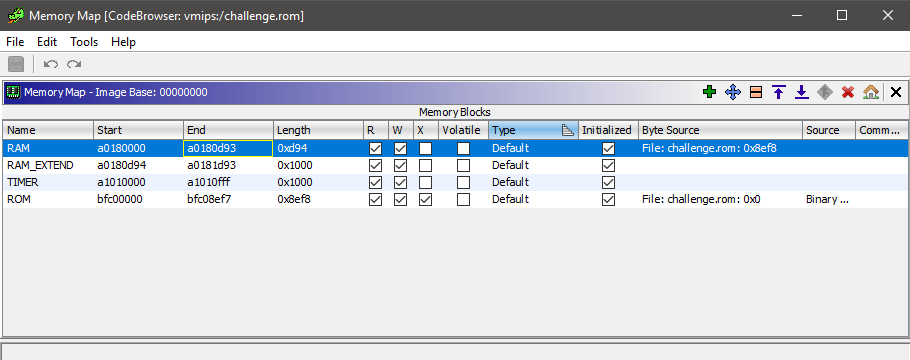
This loop is copying data from the ROM, starting from address 0xbfc08ef8 to 0xbfc09c8c, to another address - 0xa0180000. Later, we see that data from 0xa0180000 is continously referenced, so we can reasonably deduce that it’s the RAM/data segment being intialized.
After identifying RAM, we have to tell Ghidra where RAM is located so that Ghidra’s code analysis will be able to resolve addresses and strings. This is doable through Ghidra’s Memory Map window, where we can create a new RAM segment, and initialize its data with data at an offset in the ROM.
Next, we can begin digging into the main logic of the binary. A quick way to gain the big picture of what a binary is doing is through examining strings. With the RAM segment set-up, we can see numerous calls in the code similar to this:
debug_print(4,s_MAC::Process_a0180b70);
Some of the strings we see include:
MAC::Process
MAC::UL DATA_BLOCK Invalid CRC-16
RLL::Radio Link Layer Process (UL/DL processing)
RLL::UL MAC PDU
RLL::Radio Resource Layer Process (UL/DL processing)
RRL:: AP SETUP REQUEST CREATED NEW AP[%u]
With these strings, we can do a little bit of recon to find this or this. These articles tell us that we are dealing with a telecommunication protocol at the medium access control layer - which is part of the data link layer.
The role of the data link layer is to transfer data between the network layer and the physical layer, where the network layer consists of incoming packet data and the physical layer is the baremetal device the firmware is running on top of. After packets are parsed, the RRC performs actions with the data.
Additionally, we can see references to strings referencing AP’s, access points. We can reasonable guess that the RRC will be handling AP creation, deletion, and similar.
Next, we begin reversing the bulk of the code. The most difficult task when reversing this binary was by far the struct identification.
+1 again to Ghidra’s struct editor, which provides a very nice interface. There was a total of 9 structs created, some of which had a lot struct members. One of which is shown below:
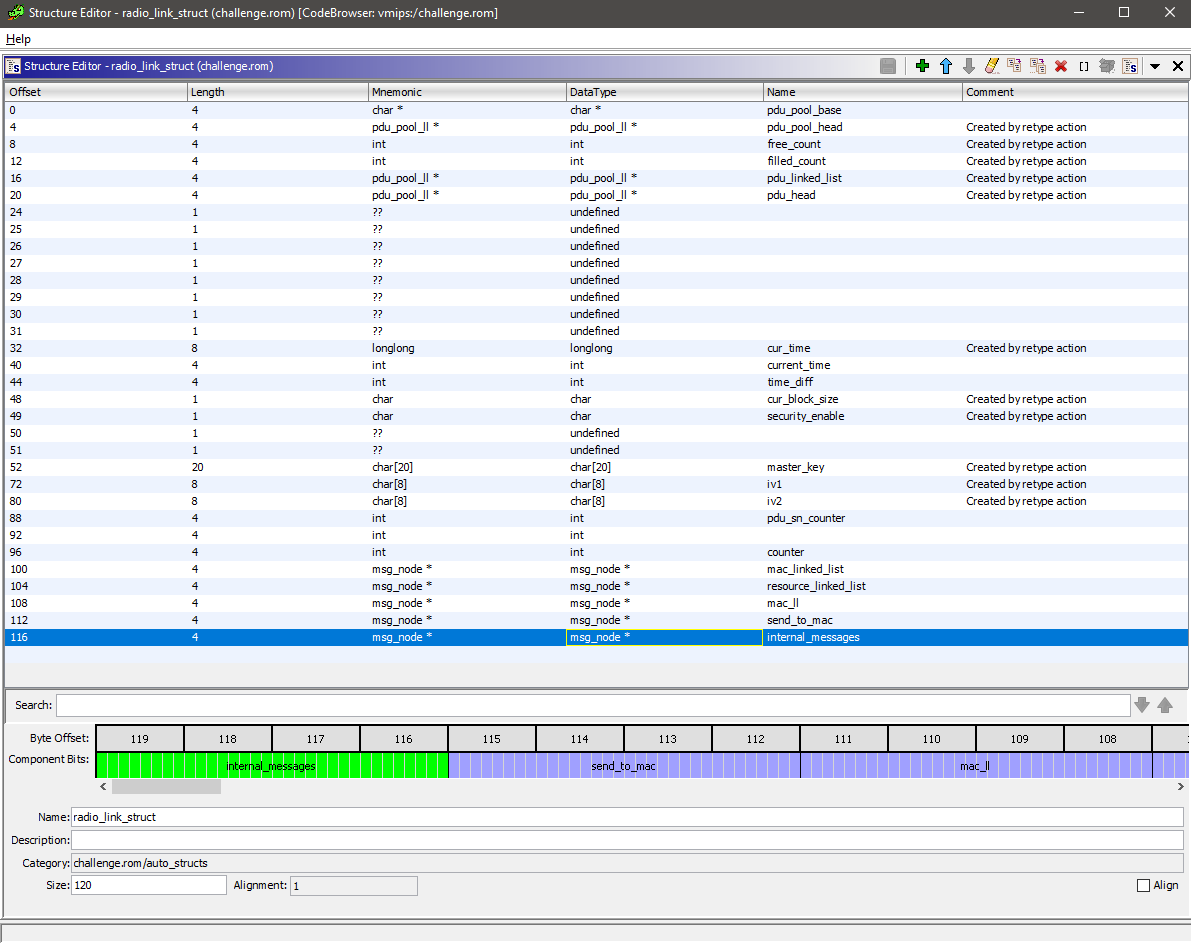
Each and every member of the struct’s function have to be reverse engineered and given an appropriate name, which was very time consuming. Consequently, once the structs are identified, the binary becomes simple to understand.
After a hefty 20 or so hours of staring at Ghidra, we understood the code in full. The main logic is shown below
void main_logic(void) {
  msg_node **str2_00;
  char local_1300 [4120];
  mac_struct important1;
  radio_link_struct important2;
  pdu_struct important3;
  msg_node *str5;
  msg_node *str4;
  msg_node *str3;
  msg_node *str2;
  msg_node *str1;

  // Global data initialization
  FUN_bfc08ba8(local_1300);
  communication_buffer = local_1300;
  init_prng();
  //set debug prints to 0, more explanation in the debugging section
  set_debug(0);
  // Initializing communication linked lists
  create_head((msg_node *)&str1,s_UL:_MACRLL_a0180d3c);
  create_head((msg_node *)&str2,s_UL:_RLLRRL_a0180d48);
  create_head((msg_node *)&str3,s_DL:_RRLRLL_a0180d54);
  create_head((msg_node *)&str4,s_DL:_RLLMAC_a0180d60);
  create_head((msg_node *)&str5,s_GLOBAL_a0180d6c);
  // Initialize MAC Layer, Radio Link Layer, Radio Resource Control Layer structs
  make_struct(&important1,&str1,&str4,(msg_node *)&str5,communication_buffer);
  make_struct2(&important2,&str1,&str2,&str4,(msg_node *)&str3,(msg_node *)&str5);
  str2_00 = &str2;
  make_struct3(&important3,str2_00,(msg_node *)&str3,(msg_node *)&str5);
  setup_timer1(&important1,str2_00,0,0);
  setup_timer2(&important2,str2_00,0,0);
  do {
    mac_receive(&important1); // MAC Processing
    radio_link_layer(&important2); // Radio Link Layer
    process_resource(&important3); // Radio Resource Control Layer
  } while( true );
}
The binary consists of three main “layers” - the MAC Receive Layer, the Radio Link Layer, and the Radio Resource Process layer. I will be referring to these as layers 1, 2, 3 respectively.
Layers 1 and 2 communicate with each other through a msg_node* linked list. Similarly, layers 2 and 3 do the same. The second RLL layer is the glue between the first and third layer, handling the interlayer communication continously.
User input is, as expected, sent to the MAC Receive layer. It is then parsed, some packet metadata stripped, then a packet is sent to the Radio Link Layer with data. The Radio Link Layer then handles encryption/decryption of packets (if necessary), and constructs a packet that is sent to the third layer.
The Radio Resource layer then takes the data, interprets some metadata, and performs AP creation, deletion, and lookups. These packet metadata have opcodes that is then interpreted by each layer to perform a different functionality. A diagram with all of the opcodes and functionalities is shown below.
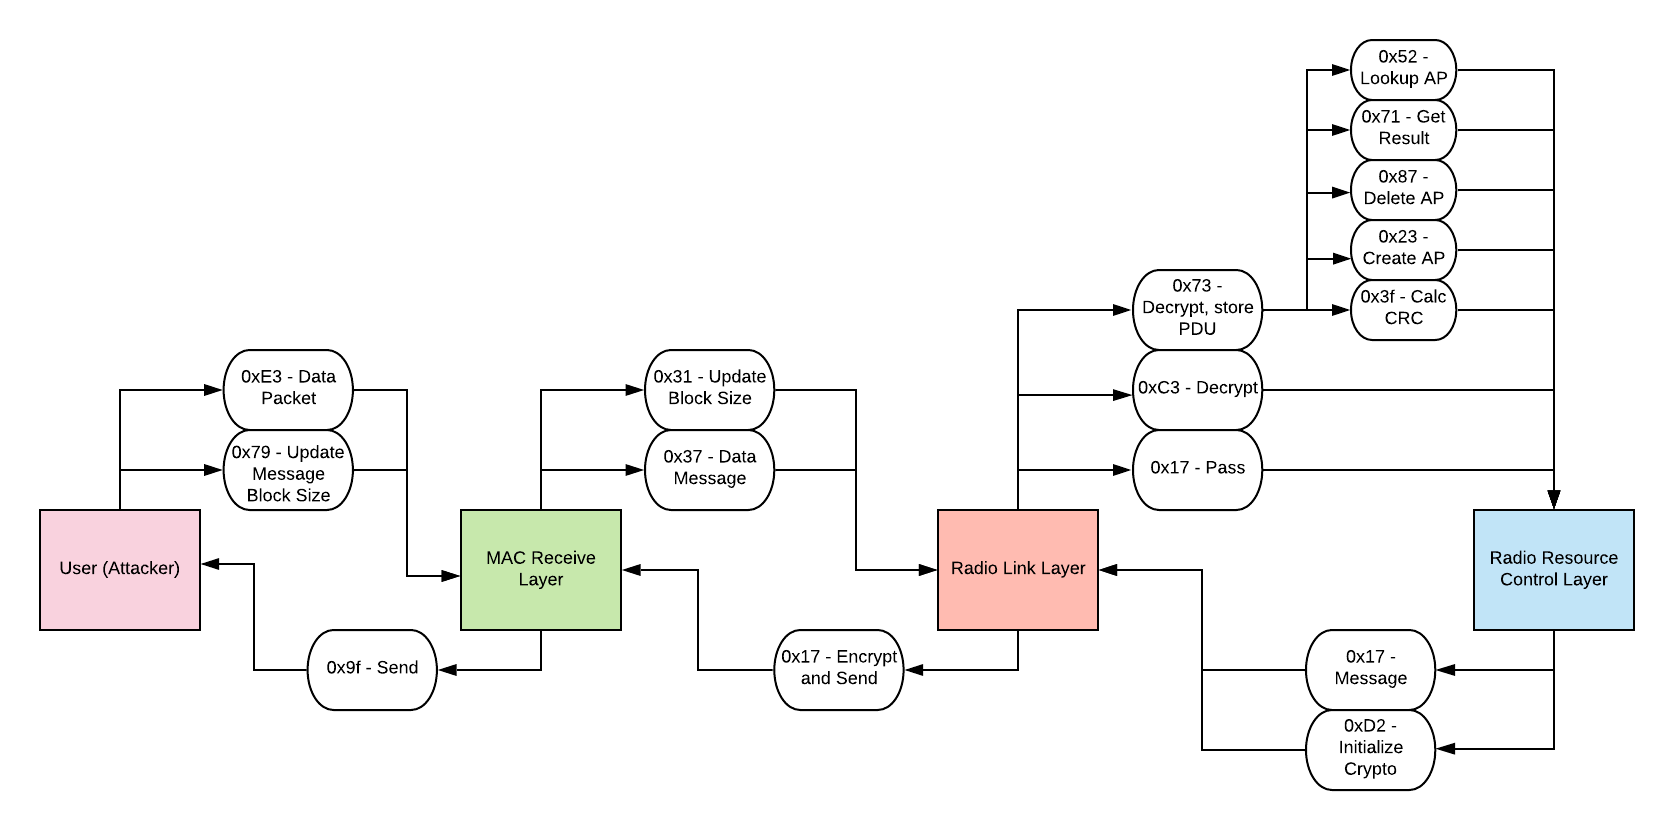
The packet sent by us, the attackers, include a packet opcode, CRC16 of the data, and the data itself which contains more packet metadata used by the third layer. For certain opcodes, the RLL encrypts our data, so we need to figure out how the encryption works to communicate with the third layer.
The cryptography works by first having the user send the only unencrypted packet opcode, with opcode 0x17 for the third layer. This initializes crypto keys, and two IV’s using PRNG. The two IV’s are used for encryption between layers 1<->2 and 2<->3.
The encryption algorithm is XTEA in decoder mode with the IV serving as a CTR, generating an xor keystream. Since all the transactions are deterministic, we can simply extract the key and IV, and recreate the xor keystream ourselves to encrypt messages to send.
Now that the binary is reversed, we can begin searching for the vulnerability.
Vulnerability
It turns out we were extremely unlucky during the reverse engineering process. While reversing, we skipped around the binary, prioritizing routines that looked simple. Additionally, we were biased towards layer 3, which is where you would expect the vulnerability to be.
However after spending a lot of time looking at the third layer and reversing its Access Point structs and failing to spot the vulnerability, we finally decided to finish reversing the final struct and opcodes of the program in the second layer.
The opcode 0x73 sent from layer 2 to layer 3 consists of a lot of PDU (Protocol Data Unit) structs that we neglected until the end. This routine stores packets sent from the MAC Layer until the packets ID’s that are sent are contiguous, meaning that all of the packets have been received and are ready to be sent to layer 3. This is how the Radio Link Layer handles sending data larger than the packet size supported by the MAC Layer.
The bug is a stack buffer overflow vulnerability when the maximum packet size (0xc0) from the MAC Layer is used to send the maximum number of packets (16) for the Radio Link Layer.
The Radio Link Layer takes these packets, merges them, then applies the XTEA XOR keystream decryption to it. However, the decrypted buffer is not large enough to contain all of this data, leading to a stack buffer overflow. The vulnerable code is shown below:
undefined4
copy_data(pdu_data_packet *pdu_data_struct,char* dest,uint max_length,undefined2 *size_of_dec) {
  uint sig;
  undefined4 uVar1;
  char *curchar;
  char **buf_ptr;
  int size;

  sig = get_signature(pdu_data_struct);
  uVar1 = 0;
  if (sig <= max_length) { // Faulty check for length
    buf_ptr = pdu_data_struct->buf_start;
    size = 0;
    do {
      curchar = *buf_ptr;
      if (curchar != 0x0) {
        memcpy(&dest[size], *(char **)curchar, (uint) curchar[4]); // Copy data into stack buffer
        size = size + (uint) (*buf_ptr)[4]; // Size is not bounds checked
      }
      buf_ptr = buf_ptr + 1;
      uVar1 = 1;
    } while (buf_ptr != (char **)&pdu_data_struct->sn_num); // Iterate through each separate packet
    *size_of_dec = (short)size;
  }
  return uVar1;
}
Now we can then proceed to exploitation. But before that, we have to set-up a debug environment, which turned out to be surprisingly annoying.
Debugging
Remember the debug_print function shown at the start? It was being called multiple times every iteration with juicy debug info (that would help us in exploit dev) but nothing was ever getting printed. Wouldn’t it be nice to get it working?
int debug_print(int fd,undefined *fmt,...) {
  undefined4 in_a2;
  undefined4 in_a3;
  int iVar1;
  undefined4 local_res8;
  undefined4 local_resc;
  char acStack1040 [1024];
  undefined4 *local_10;

  local_10 = &local_res8;
  iVar1 = 0;
  if ((fd & X_global_var) != 0) { // Global debug flag
    local_res8 = in_a2;
    local_resc = in_a3;
    iVar1 = __vsnprintf_internal(acStack1040);
    printf2(s_DEBUG::%s_a0180418,acStack1040); // Do debug print
  }
  return iVar1;
}
From the code, it can been seen that the debug print will only work if the X_global_var is not 0. Tracing the cross references, it is being set to 0 right after initialization. This is why there was no debug output.
Patching this was easy as replacing the beq (branch if equal) at 0xbfc01808 to bne (branch if not equal), essentially inverting the logic.
Running the ROM again, we are blasted with debug prints.
Although it was nice to get these working, they are still just the built-in debug prints. To aid in exploit writing, a somewhat more sophisticated debug setup is required.
By default, vmips ships with gdbserver support. However the implementation is very broken and the protocols differ between GDB versions, so we couldn’t work with it.
Instead of fixing the gdbserver, we decided to go in a completely different direction and use the internal tracing mechanism of vmips.
Passing the parameter -o instdump to vmips would make it log every instruction to stderr, which could be used to trace exactly how the execution progressed and what branches were taken.
Theoretically, that sounds pretty good. But one big issue was that this made the emulator insanely slow as writing to stderr after every instruction was a huge overhead.
Even after running for 5+ minutes, it didn’t even complete the initial copy loop, therefore rendering it useless for our purpose.
Another mechanism was -o tracing where we could provide the tracestartpc (start tracing PC) and tracestartpc (end tracing PC), essentially only tracing the instructions between those two addresses. Unfortunately, it didn’t work.
Looking into the vmips source code, the CPU::open_trace_file() was broken.
void
CPU::open_trace_file ()
{
  char tracefilename[80];
  for (unsigned i = 0; ; ++i) {
    sprintf (tracefilename, "traceout%d.txt", i);
    if (!can_read_file (tracefilename))
      break;
  }
  traceout = fopen (tracefilename, "w");
}

bool can_read_file (char *filename) {
  assert (filename && "Null pointer passed to can_read_file ()");
  FILE *f = fopen (filename, "r");
  if (!f)
    return false;
  fclose (f);
  return true;
}
Basically, it’s expecting the can_read_file() to return false if the file is readable whereas the opposite happens. So the tracing argument just puts the emulator in an infinite loop.
Again, we patched this and got tracing to work. We could now see what addresses it executed and what branches it took. We are slowly making progress…
Another argument we could pass was -o dumpcpu, which would dump the CPU state (registers and stack) at every instruction, but that didn’t work either. Later, we realized that they had a custom run_fast() function in vmips which would skip over the vmips::dump_cpu_info() function call.
So instead of relying on only the internal vmips mechanism, we decided to write a custom patch ourselves which would dump the CPU state at a targeted instruction.
A patch like that would be large and impossible to fit in the binary, but this was our time to shine. We developed an ELF Patching library (ELFPatch) last year (planning to open-source soon) and this was the perfect scenario to use it.
The plan was to hook vmips::step() and call CPU::dump_regs() function if we are at the right instruction. Here is how it looked in code:
from ELFPatch import ELFPatch

f = ELFPatch("./vmips")

#patch at 0x1fbdd in vmips::step()
new_patch = f.new_patch(virtual_address=0x1fbdd, size=0x200, append_original_instructions=True, append_jump_back=True)

new_patch.update_patch(f.assembler.assemble("""

push_regs:    ; save registers to stack
push rax
push rbx
...

do_stuff:
mov rdi, QWORD PTR [r14+0x10]   ; the CPU member
mov rcx, rdi
add rcx, 344
mov ecx, DWORD PTR [rcx]        ; load the PC (instruction pointer)
cmp ecx, 0xa00fe77c             ; compare to a hardcoded value
jne end                         ; continue normal execution if PC is not what we want

lea rsi, [0x245600]            ; load stderr
mov rsi, QWORD PTR [rsi]
call 0x15030                   ;call CPU::dump_regs() with stderr

end:
pop_regs:   ; restore saved registers
pop r15
pop r14
pop r13
...
""",offset=new_patch.chunk.virtual_address))

print("New Patch at", hex(new_patch.chunk.virtual_address))
f.write_file("./vmips_patched")
YEEET, now we could print the full CPU state at any instruction. This was good enough for us to start developing an exploit.
Exploitation
First we have to trigger the bug. To trigger the overflow, we have to specify the packet ID that we are constructing through the SN num, which is the lsb of the second byte.
Once contiguous SN nums are filled up, the packet is then decrypted and placed onto a buffer on the stack, which triggers the overflow. So, we can begin sending packest starting from the last SN num - 16.
res.append(message_block(b"\x73\x0f\x80\x23" + b"A"*0xb9))
res.append(message_block(b"\x73\x0e\x80\x23" + b"A"*0xb9))
res.append(message_block(b"\x73\x0d\x80\x23" + b"A"*0xb9))
res.append(message_block(b"\x73\x0c\x80\x23" + b"A"*0xb9))
res.append(message_block(b"\x73\x0b\x80\x23" + b"A"*0xb9))
res.append(message_block(b"\x73\x0a\x80\x23" + b"A"*0xb9))
res.append(message_block(b"\x73\x09\x80\x23" + b"A"*0xb9))
res.append(message_block(b"\x73\x08\x80\x23" + b"A"*0xb9))
res.append(message_block(b"\x73\x07\x80\x23" + b"A"*0xb9))
res.append(message_block(b"\x73\x06\x80\x23" + b"A"*0xb9))
res.append(message_block(b"\x73\x05\x80\x23" + b"A"*0xb9))
res.append(message_block(b"\x73\x04\x80\x23" + b"A"*0xb9))
res.append(message_block(b"\x73\x03\x80\x23" + b"A"*0xb9))
res.append(message_block(b"\x73\x02\x80\x23" + b"A"*0xb9))
res.append(message_block(b"\x73\x01\x80\x23" + b"A"*0xb9))
And we get:
Segfault at 0x41414141! That’s what we like to see.
Since we are exploiting a firmware ROM and usually firmwares lack any sort of mitigations such as canaries and NX, maybe this does too?
Indeed, vmips doesn’t support any fancy mitigations, so we can directly overwrite the return address and achieve PC control. The question is then, what do we overwrite the return address with?
Using ROP may have been a valid option, but since there are essentially no memory protections, we could just get shellcode execution.
Therefore, we opted to leak the deterministic stack address of our buffer data through debugging, and jump there to gain full code execution.
As we jumped to the stack, the emulator died. We guessed that the emulator’s stack is specially treated as it is not mapped by the firmware ROM itself, so we instead tried jumping to our buffer in RAM and sure enough…
Our test shellcode that runs in an infinite loop works!
Now all that’s left is to write shellcode that iterates through the flag device location 0xa2008000 in intervals of 4 and writes that data to the communication buffer between the vmips emulator and the user.
Aaaand let’s test it on remote.
PWNED!!
The final exploit is available here
Afterthoughts
Now that we look over our whole process again, here are a few things we learned and what we could have done better:
- Ghidra is amazing for reversing non-mainstream architectures with an awesome collaboration setup - we will definitely be using it more from now on.
- We shouldn’t have given up at the end. If only we had spent a little more time reversing, we might have solved it during the CTF timeframe.
- Familiarity with good tools is a priceless asset during a competition. Without Ghidra’s decompilation, we would have never finished reversing this binary, and without ELFPatch, we would have spent a lot more time setting up debugging.
Overall, we learned a lot from the challenge. From reversing a completely stripped binary blob to understanding the three layered data link protocol, it had everything.
Thank you for reading and a big shoutout to Hack-A-Sat organizers for designing such an interesting challenge.
For any questions/clarifications, you can contact either VoidMercy or Jazzy.